Built-In Panels
Versions
flask_debugtoolbar.panels.versions.VersionDebugPanel
Shows the installed Flask version. The expanded view displays all installed packages and their versions as detected by setuptools.
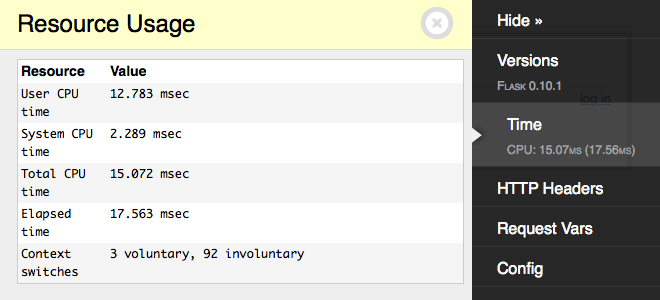
Time
flask_debugtoolbar.panels.timer.TimerDebugPanel
Shows the time taken to process the current request. The expanded view includes the breakdown of CPU time, by user and system, wall clock time, and context switches.
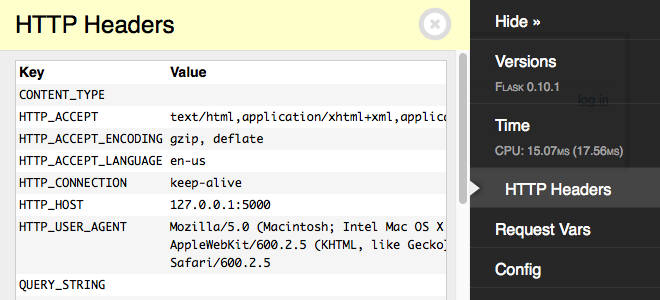
HTTP Headers
flask_debugtoolbar.panels.headers.HeaderDebugPanel
Displays the HTTP headers for the current request.
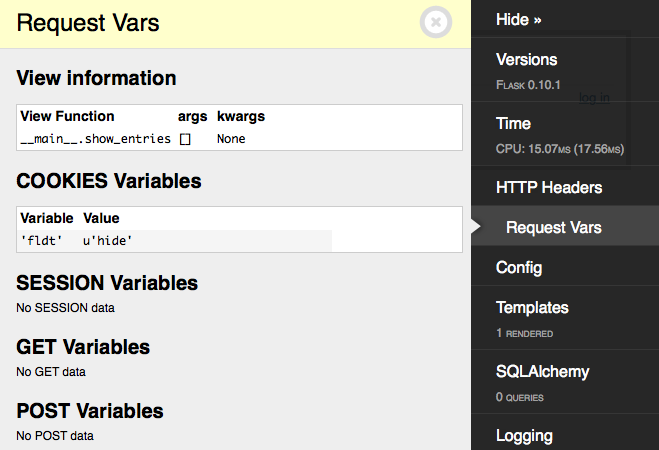
Request Vars
flask_debugtoolbar.panels.request_vars.RequestVarsDebugPanel
Displays details of the Flask request-related variables, including the view function parameters, cookies, session variables, and GET and POST variables.
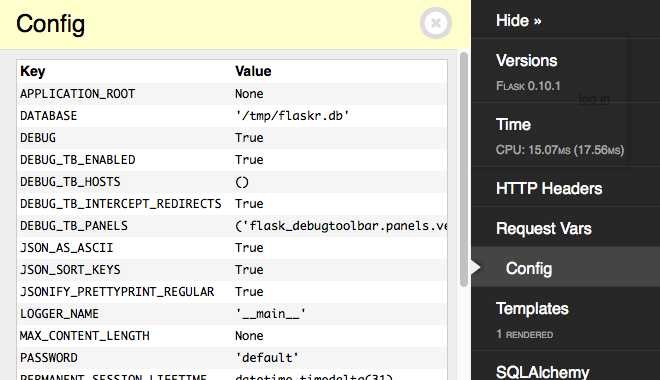
Config
flask_debugtoolbar.panels.config_vars.ConfigVarsDebugPanel
Shows the contents of the Flask application’s config dict app.config.
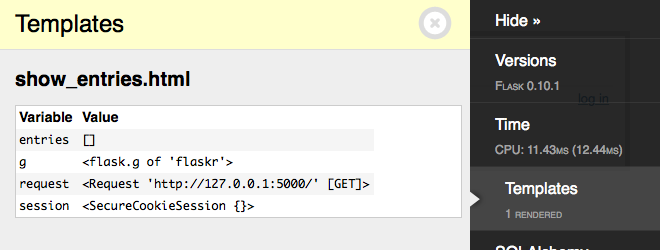
Templates
flask_debugtoolbar.panels.template.TemplateDebugPanel
Shows information about the templates rendered for this request, and the value of the template parameters provided.
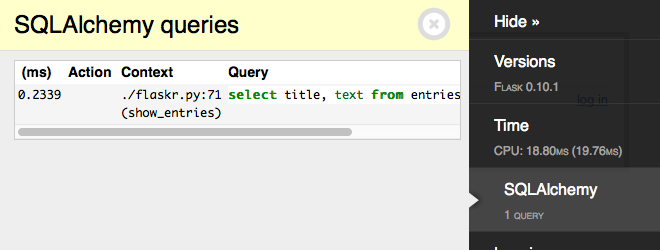
SQLAlchemy
flask_debugtoolbar.panels.sqlalchemy.SQLAlchemyDebugPanel
Shows SQL queries run during the current request.
Note
This panel requires using the Flask-SQLAlchemy extension in order to record the queries. See the Flask-SQLAlchemy Quickstart section to configure it.
For additional details on query recording see the
get_debug_queries() documentation.
Note
SQL syntax highlighting requires Pygments to be installed.
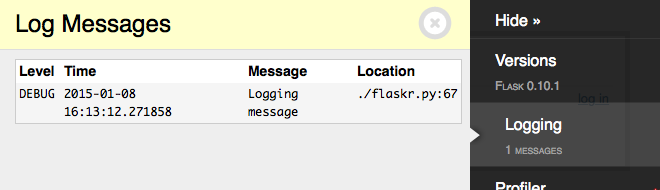
Logging
flask_debugtoolbar.panels.logger.LoggingPanel
Displays log messages recorded during the current request.
Route List
flask_debugtoolbar.panels.route_list.RouteListDebugPanel
Displays the Flask URL routing rules.
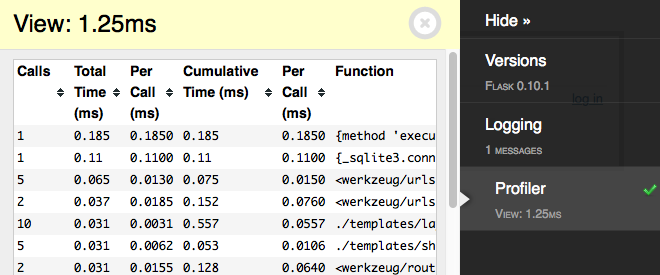
Profiler
flask_debugtoolbar.panels.profiler.ProfilerDebugPanel
Reports profiling data for the current request. Due to the performance overhead, profiling is disabled by default. Click the checkmark to toggle profiling on or off. After enabling the profiler, refresh the page to re-run it with profiling.